Preserving our environment is a global public good which requires internationally coordinated climate policies. Unfortunately, this is not the case today. The most effective climate policy, known as ‘carbon pricing’, has until now, been locally implemented at regional, national, or supra-national levels with little coordination. The world’s largest carbon-pricing system is the European Union’s Emission Trading Scheme (EU ETS), which operates independently of the joint Californian emission trading scheme (Schmalensee and Stavins, 2017). China and India have also adopted their own cap-and-trade scheme on energy intensity (Zhang et al. 2017, Oak and Basal, 2022) While elsewhere, other countries implement a corporate carbon tax.
The effectiveness of carbon price in reducing greenhouse gas emissions through carbon leakage is undermined due to a lack of global coordination combined with international trade. Carbon pricing aims at incentivizing firms to curb their own emissions by assigning a value to each ton of carbon dioxide emitted. Carbon can leak if local production is moved abroad in a country with lower carbon price or substituted by imports from this country. Carbon leakage does not only harm the economy (employment, profits, tax collected including through carbon pricing) but also harms our climate since the emission reductions targeted by carbon tax, or the cap on pollution allowances, are not met.
To address carbon leakage, the EU Commission has drafted a Carbon Border Adjustment Mechanism (CBAM) to be discussed in the EU parliament and the Council of member States. The CBAM requires importers to pay the cost of emissions corresponding to carbon footprint of the imported products, based on the EU ETS price. The CBAM is supposed to replace the existing policy that has been addressing carbon leakage: free allowances assigned to companies that are carbon-intensive and/or exposed to international competition (Martin et al. 2014).
How free allowances and the CBAM impact emissions and trade?
Using a graphical illustration with the supply curve, the demand curve, and the emission factors of domestic and foreign products (Figure 1), free allowances and the CBAM impact trade and greenhouse gas emissions differently. By leveling the playing field domestically and abroad, free allowances not only reduce imports but also allow to export, which is good for the environment when the emission factor of domestic products is lower (as shown in Figure 1).
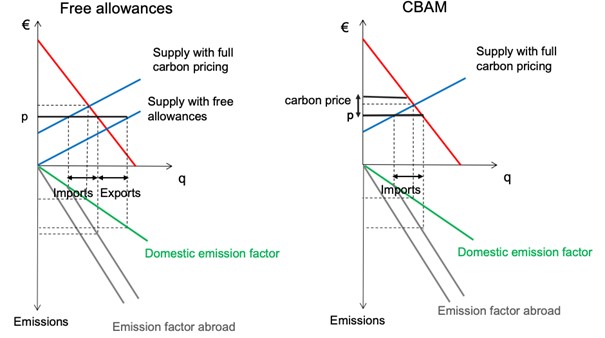

Figure 1: Impact of free allowances (left) and the CBAM (right) on trade and emissions.
In contrast, the CBAM levels the playing field only in the domestic market. Doing so, the CBAM reduces higher carbon intensity imports into the EU but does not supply a level playing field for the export of less carbon-intensive products leaving the EU. To level the playing field and avoid carbon leakage on international markets, the CBAM must be complemented by (i) a refund of carbon pricing on exports (an export rebate, or free allowances only on exports) or/and (ii) a subsidy on pollution abatement investments (e.g., subsidizing investment into green powered production of steel, or into carbon sequestration and storage).
Consistently, the amendment adopted by the EU parliament on the EU CBAM project specifies that manufacturers “shall continue to receive free allocation, provided such products are produced for export to third countries without carbon pricing mechanisms similar to the EU ETS”. The phase out of free allowances up to 2032 applies only for production markets within the EU, not abroad. Furthermore, a significant share of the EU recovering and resilience funds aims at financing the decarbonation of energy-intensive production facilities such the AcelorMittal steel production plant in Dunkerque.
Challenges to the design of the CBAM
The CBAM adds a further complexity to carbon pricing: the pricing base is not the manufacturing plant but rather the imported product. This presents several challenges:
-
Measuring Carbon Footprint of an output produced outside the EU jurisdiction
Estimating the carbon footprint of a product using data on the emissions from the manufacturing plant is not easy. When it comes to foreign products, data on emissions are not always available, or reliable. One solution proposed in the EU CBAM project is to use the carbon footprint of the EU products as a benchmark (of the 10% less carbon intensive products). Its drawback is that foreign producers have no incentive to reduce carbon footprint of their own products by investing into pollution abatement. Benchmarking carbon footprint of foreign products avoids “resource shuffling”: foreign companies cannot allocate all decarbonated inputs (e.g., renewable sources of energy) to exports in order to reduce the carbon footprint of their product without investing into pollution abatement. Another solution proposed in the EU CBAM gives the option to importers to certify carbon footprint of their product when it is lower than the benchmark. A further measurement issue that must be addressed is how to allocate emissions of a multiple-product manufacturing plant among the different products supplied to the market.
-
Adjustment to local carbon pricing and climate policy with the idea of ‘climate clubs’
To level the playing field, importers should only pay the difference between the domestic carbon price and the one charged to the manufacturer abroad. Comparing carbon prices are on occasions implicit and may raise issues (with non-tradable emission caps or technological standards) or expressed in different units (India and China have cap-and-trade systems on emission intensity rather than emissions). Carbon pricing adjustment to existing carbon prices provides incentives to countries to form a “climate club” à la Nordhaus (2015).
-
The scope of emissions: only 1 (direct emissions) or also 2 (indirect emissions)
The current EU proposal recommends including only direct emissions in the calculation of the product’s carbon footprint, the so-called Scope 1. Although it has the merit of simplicity, ignoring indirect emissions imbedded into inputs (Scope 2), might not only underestimate carbon footprint but also might create perverse incentives. For instance, a manufacturing plant can dramatically reduce carbon footprint on its product by switching from in-house energy generation to grid power even if the power purchased from the electricity company comes from a coal thermal power plant.
-
The fact that only a subset of raw products or sectors are involved in the CBAM
The products and sectors included in the EU CBAM proposal (cement, iron and steel, aluminum, electricity, fertilizers) are inputs for several manufacturing products produced in Europe such as cars and planes. By increasing the cost of those products within the EU, the CBAM might lead to carbon leakage in other sectors downstream the supply chain of manufactured products. Car and plane manufacturers might have access to cheaper steel, electricity, or aluminum by moving their production plant abroad.
Text prepared for the Seventh CEPR/EAERE Webinar on Climate Policy Monday March 21, 2022 and updated on July 5, 2022.
References
Martin, Ralph, Mirabelle Muûls, Laure B. De Preux and Ulrich J. Wagner (2015) Industry Compensation under Relocation Risk: A Firm-Level Analysis of the EU Emissions Trading Scheme, American Economic Review 2014, Vol. 104, No. 8, pp. 2482–2508.
Nordhaus, William (2015) Climate Clubs: Overcoming Free-Riding in International Climate Policy, American Economic Review, Vol. 105, No 4, pp. 1339-70.
Oak, Hena, and Sangeeta Bansal (2022) Enhancing Energy Efficiency of Indian Industries: Effectiveness, Manuscript.
Schmalensee, Richard, and Robert Stavins (2017) Lessons Learned from Three Decades of Experience with Cap and Trade, Review of Environmental Economics and Policy, volume 11, issue 1, Winter 2017, pp. 59–79.
Zhang, Unjie, Zhenxuan Wang and Xinming Du (2017) Lessons Learned from China’s Regional Carbon Market Pilots, Economics of Energy & Environmental Policy, Vol. 6, No. 2.
Photo © Pexels